Pesto can trace its roots back to ancient times, though it really only started taking off in North America in the 1980s and 90s. Though the primary base is consistent, with pine nuts, basil, and olive oil, individual recipes vary. As canned and bottled pesto became more accessible, individual manufacturers developed their own unique flavor profiles. While these recipes are usually trade secrets, the power of GCxGC TOFMS can tease apart some of the differences.
LECO’s Pegasus® BT 4D is capable of detecting hundreds or thousands more individual analytes than a simple single-dimensional GC-MS analysis with a single run. This provides a wealth of rich, high-quality data as shown in a recent pesto aroma profile app note. With software tools such as ChromaTOF® brand software‘s “References” function, individual analytes can be selected and compared between samples or sample sets, such as this view of Estragole from four different manufacturers’ pesto.
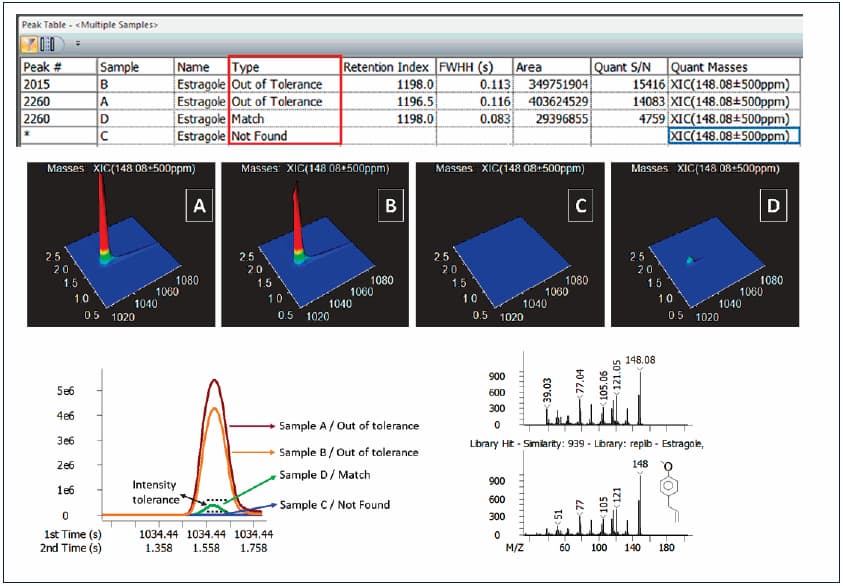
Example of the Reference feature in LECO’s ChromaTOF SW. The automated comparison of four examined samples resulted in categorization of the Estragole peak as Match (sample D), Out of tolerance (samples A, B) and Not-Found (sample C). The peak intensity can be then also compared on (i) 3D plots of estragole and (ii) overlayed linear plots of the most abundant GCxGC slice.
Having too much data might feel overwhelming, though. When you have thousands of analytes to sort through, finding the ones that make a difference can feel like an impossible task. However, ChromaTOF Tile was designed to take that impossible task off your shoulders.
ChromaTOF Tile is a data processing software platform developed using Professor Rob Synovec’s Tile-based Fisher-ratio approach and designed to intelligently compare sets of GCxGC data. By applying this software to eleven samples from three different manufacturers, patterns and groupings began to form.
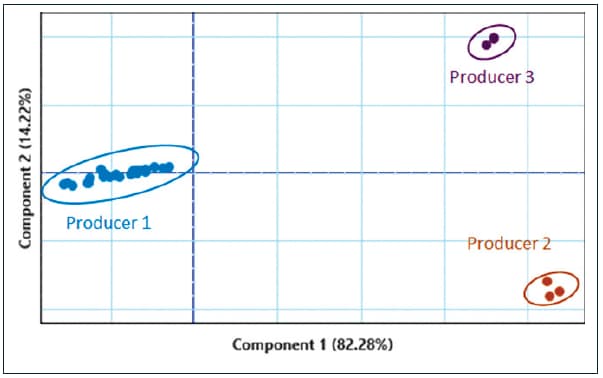
PCA plot with great separation of sample classes.
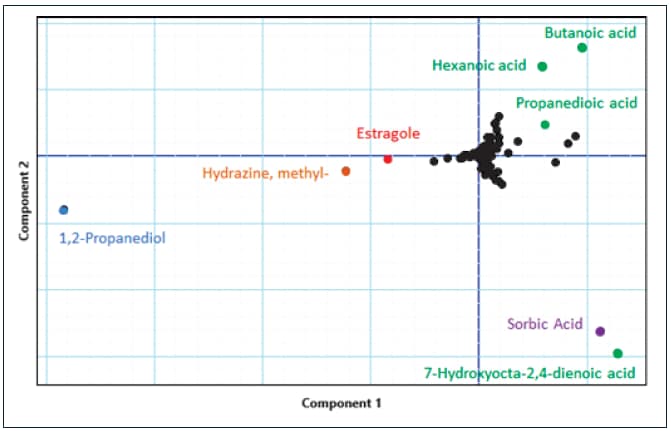
Loading plot of above mentioned PCA plot with most marked distinguishing components identified as 1,2-Propanediol, butanoic acid, 7-Hydroxyocta-2,4-dienoic acid, hexanoic acid, propanedioic acid, Estragole, Methylhydrazine and Sorbic acid.
This automated breakdown of the data allows for a quicker robust understanding of the products involved, aiding in product development or understanding consumer test data. For a more detailed look at how ChromaTOF Tile can assist with data processing of pesto samples.